
 DCTC KSA

- Blogs
- / Key Metrics for Evaluating Event Sponsorship Success
More event data does not automatically mean more sponsorship value. The key metrics for evaluating event sponsorship success include qualified leads, stand traffic, website visits and engagement with event-related content. Key performance indicators (KPIs) are the measures selected to assess progress towards sponsorship objectives. Metrics show what happened; KPIs help determine whether the outcomes that matter were achieved.
Visible activity, such as social media interactions or stand visits, can be useful, but it needs context to guide decisions. This article explains how to measure sponsorship leads, track website traffic and content engagement, and distinguish useful metrics from meaningful KPIs. You will also learn how to link each measure to a clear goal, so results can inform future sponsorship decisions in Saudi Arabia.
Key Takeaways
- Set sponsorship objectives first, then select measures that show whether the event delivered against them.
- Assess lead volume alongside lead quality and post-event conversions to understand commercial impact.
- Track event-related website visits and content interactions to see how audience engagement continues after the event.
- Separate metrics, which record activity, from KPIs, which connect selected results to your priorities.
1. What are event metrics?
Event metrics are observable measures that show how an event performed against its objectives. For a conference, organisers might compare attendance with the target, then review registration, check-in and participation records. The attendance rate compares actual attendance with the expected or targeted audience. Registration conversion shows what proportion of registered participants attended. Together, these measures indicate whether the event attracted people and brought them through the door.
Start by comparing registrations with check-ins. A high registration count alongside lower attendance can point to a gap between sign-up and participation. Track session attendance separately, because the overall audience figure cannot show which workshops or discussions drew interest. Poll responses, Q&A questions and activity participation add useful detail. For example, steady attendance but few contributions in a session may prompt organisers to review its format or relevance.
Feedback turns these activity measures into practical insights. Post-event surveys can ask attendees to rate the venue, networking and food on a 1-to-5 scale, then invite comments about improvements. The Net Promoter Score method asks how likely attendees are to recommend the event, using a 0-to-10 scale. Scores of 9 or 10 are promoters, 7 or 8 are neutral and excluded, and 0 through 6 are detractors. The score is the percentage of promoters minus the percentage of detractors.
Feedback from sponsors, exhibitors and presenters matters too. Their expectations may differ from attendee priorities, so use interviews, surveys or evaluation meetings to find out whether objectives were met. Compare feedback with attendance and networking activity rather than treating satisfaction as a standalone result.
Common pitfalls include counting registrations as attendance, relying on a single measure, and collecting feedback without linking it to an objective. Repeat attendance also needs context: compare it across events alongside session participation and survey findings. This can show whether the programme continues to serve its audience, rather than simply drawing a large crowd once.
2. Lead generation
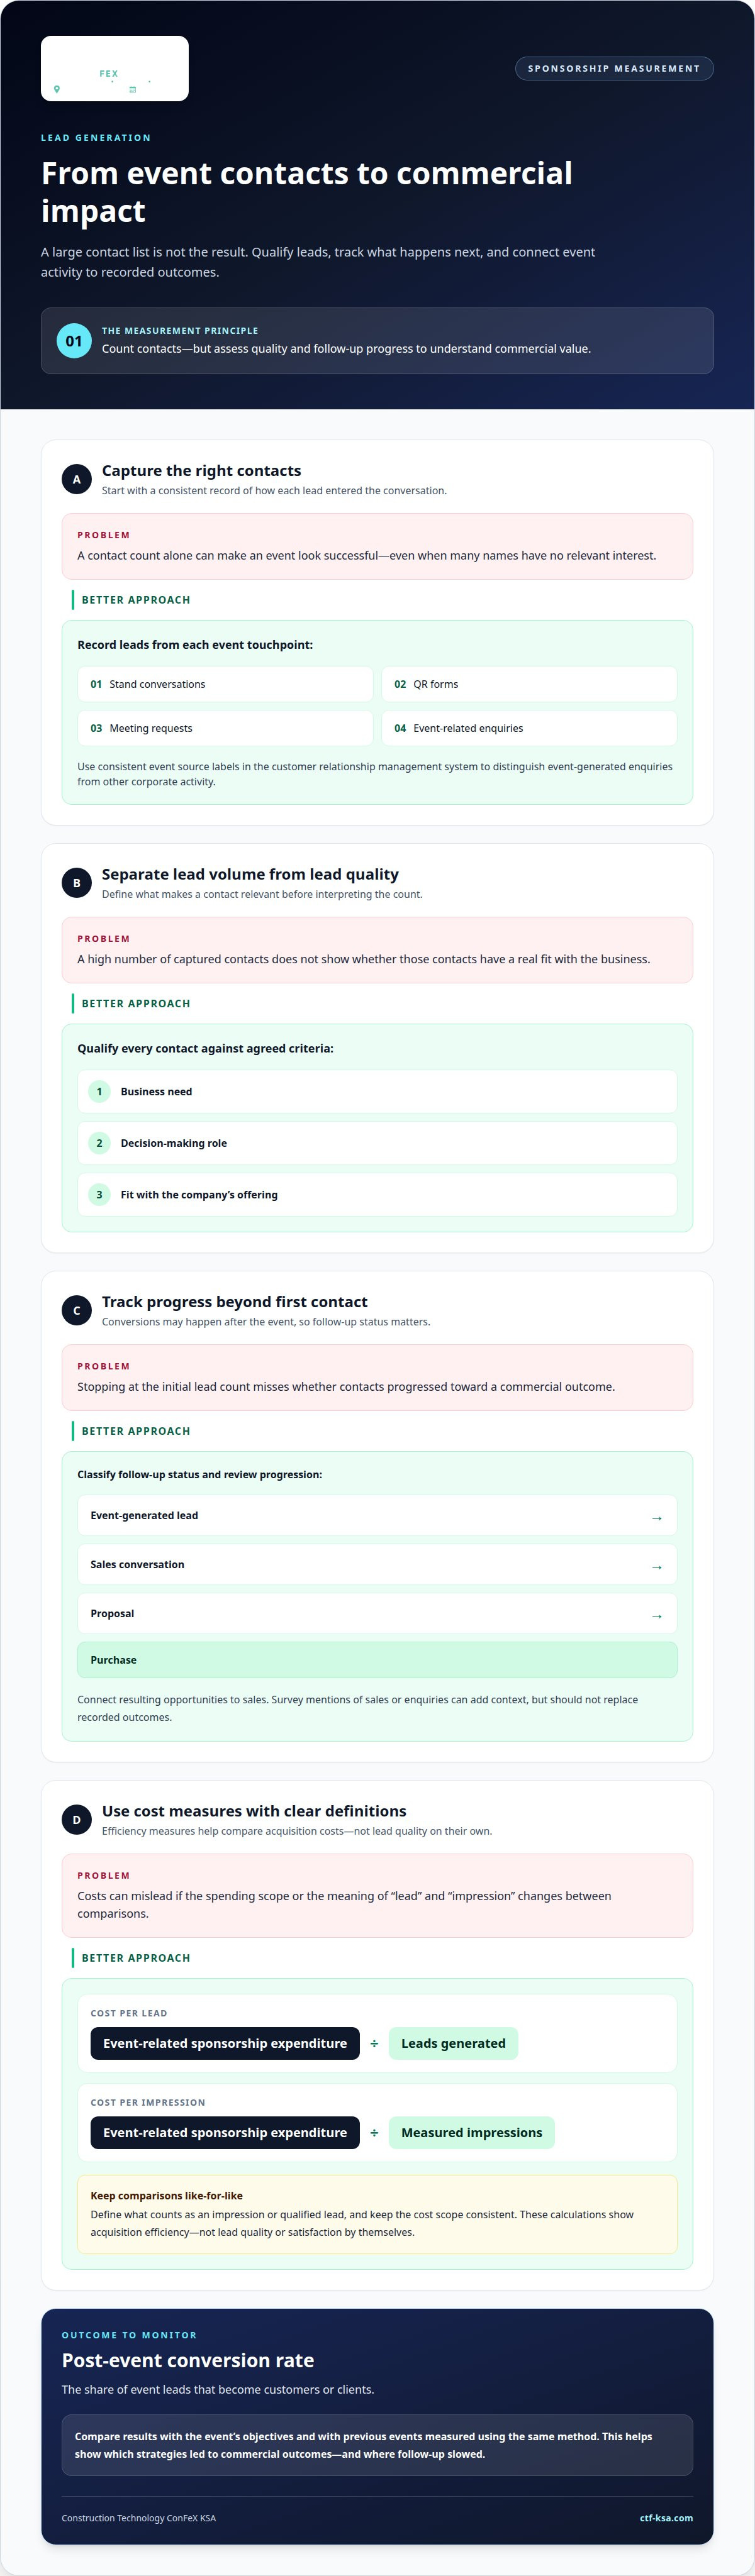
Lead generation measures the number and quality of contacts connected to an event. Count leads captured through stand conversations, QR forms, meeting requests and event-related enquiries. Then qualify each contact against agreed criteria, such as business need, decision-making role and fit with the company’s offering. At large networking events like the Los Angeles Real Estate Grand Expo, exhibitors often use these frameworks to ensure high-volume attendance translates into genuine commercial opportunities. A large contact list means little if most names have no relevant interest.
To measure sponsorship leads and sales, record each event-generated lead, track its follow-up stage and connect resulting opportunities to sales. The post-event conversion rate is the share of event leads that become customers or clients. Use consistent source labels in your customer relationship management system to distinguish event-generated enquiries from other corporate activity. Sales or enquiry mentions in follow-up surveys can add context, but should not replace recorded outcomes.
Calculate cost per lead by dividing event-related sponsorship expenditure by the number of leads generated. Calculate cost per impression by dividing that expenditure by measured impressions. Keep the scope consistent: compare like-for-like costs and define what counts as an impression or qualified lead before interpreting the results. These calculations show acquisition efficiency, not lead quality or satisfaction on their own.
Monitor progress after the event, since conversions can occur after initial contact. For example, classify leads by follow-up status, then review which progressed to a sales conversation, proposal or purchase. Compare results with the event’s objectives and with previous events measured using the same method. This gives event teams a clearer view of which strategies led to commercial outcomes and where follow-up slowed.
For a campaign designed around measurable sponsorship outcomes, explore event sponsorship opportunities and align the activation with its lead-generation goals.
3. Website traffic and post-event content engagement
Digital activity shows whether interest in an event continues beyond the venue. Track event-related website visits before, during and after the event, then compare referral sources, landing-page activity and content views. Use tagged campaign links to distinguish event traffic from other visits. For example, increased visits to a conference recap page after attendee emails can show ongoing interest, while repeat visits may indicate deeper consideration.
Measure post-event content engagement through on-demand session views, email opens and click-throughs, survey completions and uptake of exclusive offers. Each metric represents a different action: a view records exposure, while a click or completed survey shows a further response. Compare results across content formats to see which sessions or materials hold attention and inform future events.
Social media adds another layer. Monitor event-related mentions, shares, likes, comments and hashtag activity across relevant channels. Reach estimates how widely content was seen; engagement records interactions. Look at the conversations as well as the counts. Positive, critical or practical comments can reveal audience sentiment and online reputation, while attendee posts may show which topics gained traction.
To measure sponsorship brand awareness and recall, use pre-event and post-event surveys. Ask attendees which event partners they remember without prompting, then test recognition with a list of names. Comparing responses can reveal changes in recall. Asking where attendees saw each brand helps distinguish event exposure from other influences.
During sessions, record participation in polls, Q&A and chat alongside attendance. For example, compare poll responses with live session attendance to see how actively people contributed. You can also assess account influence by matching event interactions and subsequent website activity to relevant business accounts. Treat these signals as evidence of engagement, not proof of a sale. Combine them with lead-generation data and later outcomes to assess return. Consistent tracking gives organisers a stronger basis for refining content and digital strategies.
4. Event metrics versus event KPIs
A metric records an observable result; a key performance indicator (KPI) measures progress towards a priority objective. Total website visits are a metric. Qualified enquiries from those visits become a KPI when the sponsorship aims to generate sales opportunities. The distinction matters: an event dashboard can contain many measures, but only a focused selection should guide decisions.
Set event sponsorship KPIs before the event, based on the sponsor’s goals. Choose measures for qualified leads, post-event conversions, brand visibility, audience engagement or revenue, depending on the intended outcome. Define each measure clearly, including its data source, reporting period and success criteria. A lead-generation objective, for instance, needs a shared definition of a qualified lead and a way to connect event contacts with later sales activity.
During event planning, connect each KPI to a practical measurement method. Track lead capture through event forms or meeting records, use tagged links for sponsorship-related website visits, and review session attendance or poll participation to measure engagement. Investment and revenue can inform an ROI assessment, but the comparison must use relevant event costs and attributable benefits. Impressions alone cannot establish commercial return, just as lead totals alone cannot show lead quality.
Review the selected KPIs with the event team and sponsor before launch. Clear communication prevents one party from treating stand traffic as success while another expects qualified sales conversations. After the event, compare results with the agreed objectives and use the findings to refine future event strategies. Metrics are useful diagnostic indicators, while KPIs keep attention on the outcomes that make sponsorship valuable. The key takeaway is to measure broadly, but evaluate performance against a focused set of goals tied to the audience and intended business impact.
Construction Technology ConFeX KSA: Sponsorship Packages
Construction Technology ConFeX KSA gives technology providers and industry leaders a platform to connect around the digital and sustainable transformation of Saudi Arabia’s built environment. Its Sponsorship Packages are a natural next step for organisations seeking to align event participation with defined goals, such as brand visibility, audience engagement or business connections. Choose the objective first, then decide which outcomes will indicate value, from relevant conversations to follow-up enquiries.
Exhibition Stands support direct engagement with attendees, while Speaking Opportunities enable organisations to share expertise with the event audience. Delegate Passes provide access to agenda themes, speaker sessions, exhibitor booths, live demonstrations and networking opportunities. Each option serves a different participation goal, so match the format to the audience and outcomes you want to pursue.
Contact Construction Technology ConFeX KSA to discuss its Sponsorship Packages.
Turn measurement into your next move
Make your next sponsorship decision with a clear view of what your organisation wants to achieve. The key metrics for evaluating event sponsorship success are most useful when they shape what you prioritise next, not simply how you report past activity. Use the findings to refine objectives, align internal teams and build a measurement approach that supports stronger decisions across future events.
Assign an owner to each result and include it in your post-event review. A shared view of outcomes can help marketing, sales and leadership teams make decisions from the same evidence. It also provides a stronger foundation for planning partnerships that contribute to your organisation’s direction in Saudi Arabia’s built-environment sector.
Take the next step with purpose, and keep building momentum towards your goals.
Frequently Asked Questions
What are event KPIs?
Event KPIs are selected measures that show whether an event achieved its priority goals. For a corporate launch intended to strengthen customer relationships, a KPI might be the number of qualified follow-up meetings completed, rather than the total number of visitors. Similarly, in high-end corporate hospitality settings—such as VIP race weekend experiences coordinated by AIOKA—the most relevant KPIs focus on executive relationship depth and client retention rather than sheer attendance volume. Choose indicators that decision-makers can act on, and define the evidence and review period before the event begins.
What are event metrics?
Event metrics are recorded observations, such as registrations, session attendance or email clicks. A metric becomes useful for decision-making when it is interpreted against an objective or benchmark. For example, tracking registrations by campaign source can show which communication channels attracted interest, helping organisers shape promotion for a future event.
Why should I measure the success of my corporate events?
Measuring corporate events helps teams decide what to retain, change or stop in future planning. Results can show whether the format served its purpose, whether resources supported the intended outcomes and where participants encountered friction. For example, feedback about an inconvenient session schedule can guide programme adjustments, while post-event sales conversations can inform follow-up planning.
What are the key metrics for evaluating event sponsorship success?
The most useful measures depend on the sponsorship’s objective. For a brand-awareness goal, examine visibility and audience recall; for commercial goals, assess qualified enquiries and resulting business opportunities. Networking quality, audience response and sponsor feedback can add context. Consider these measures together, since a single high figure may not show whether the sponsorship delivered the outcome stakeholders valued.
How do you track audience engagement at sponsored events?
Track audience engagement through observable actions across the event experience. For example, record participation in a live demonstration, questions after a presentation and interactions during a facilitated discussion. Pair activity data with brief feedback prompts about relevance or usefulness. Comparing these signals across formats can help organisers understand what encouraged meaningful participation, not just attendance.
How do you calculate sponsorship ROI and ROO?
ROI compares financial benefits attributed to a sponsorship with its associated investment; use attributable revenue and include relevant costs in the calculation. ROO, or return on objectives, assesses progress towards non-financial goals such as awareness, relationships or thought leadership. Define the evidence for each objective in advance, then review the results against those criteria. ROO has no single universal calculation.